  • Remote Flow Monitoring
     Made Simple 

    ClipperView shows you where to focus your efforts.

Why ClipperView?

One Platform for All Your Flow Data

ClipperView integrates with your flow meters, rain gauges, and monitoring sensors to bring all your data into one dashboard. ClipperView is powered by Teledyne ISCO's Flowlink Cipher platform.

Built for Compliance and Field Insight

Set threshold alarms, overlay graphs, and prioritize field crew activity with data-driven clarity.

13+

Years of trusted flow monitoring software, reporting, and local professional support.

1000+

Satisfied Customers

350+

Clients across Industries

10+

Support Professionals

Key Features

Flow Monitoring Dashboard Icon

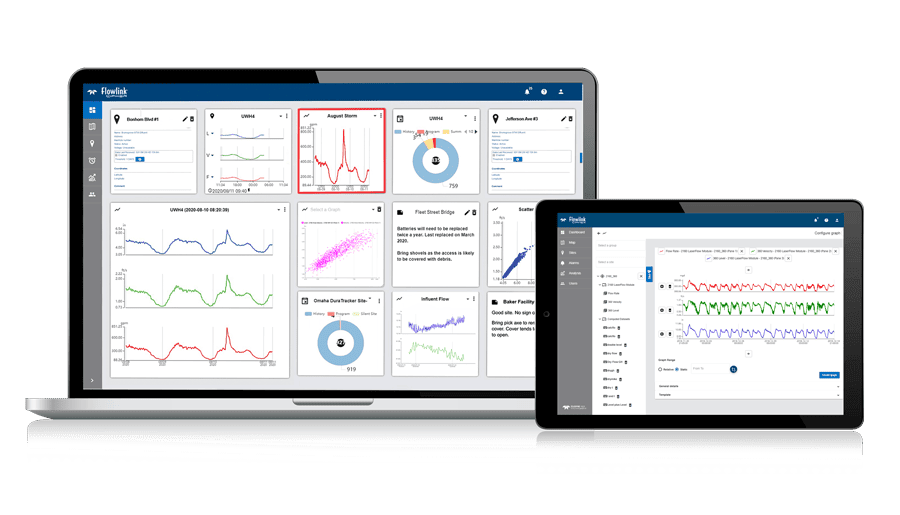
Access Flow Data Anywhere

View your site data from any device—mobile, tablet, or desktop. Easily export CSV files or receive real-time text alerts.

Wireless Icon

Wireless Data Collection

ClipperView collects and transmits sensor data automatically—no road closures, no manual downloads.

No Hardware Required Icon

No IT or Hardware Required

ClipperView is a hosted solution with a monthly subscription. No procurement delays or costly infrastructure.

Infiltration and Inflow Analysis Icon

Infiltration & Inflow Analysis

Detect extraneous flow trends and model system capacity using short- or long-term data overlays.
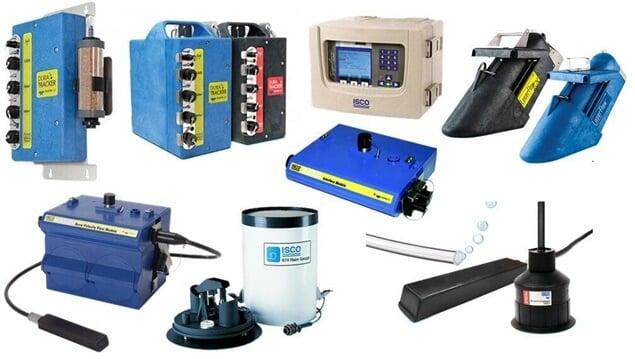
Supported Devices

  • ISCO Signature and Duratracker Instruments
  • Area Velocity Flow Meters
  • ISCO LaserFlow Sensors
  • Ultrasonic and Bubbler Flow Meters
  • 2100, 4100, and 4200 Series Data Loggers
  • 675 Series Logging Rain Gauges

Flow Instrumentation Compatible With Flow Monitoring Software

Compliance Made Easy

Clipper Controls Branded Icon

Automatic threshold alerts & alarms

Clipper Controls Branded Icon

Custom reports for audits & regulatory needs

Clipper Controls Branded Icon

Dashboard overview of all sites and sensors

Clipper Controls Branded Icon

Prioritized issue triaging for field crews

​ClipperView Pricing

ClipperView offers flexible pricing based on your connectivity needs. Whether you're just getting started or scaling up with multiple sites, each plan includes full access to the ClipperView platform, technical support, and tools designed to help you manage flow data with confidence.

I'm interested in a free trial

Clipper Controls Brand Icon

Free

For 30 Days

Explore the platform with no commitment.

  • Full access to features
  • Use your data or see sample data
  • Initial hardware configuration
Begin Trial

I already have connectivity

Clipper Controls Brand Icon

$30 Per Month/Site

+ $100 Setup Fee

For users who already have cellular connectivity at their sites.

  • Provide your own cellular 
  • Initial hardware configuration
  • Custom templates and graphs
  • Unlimited users
  • Technical support
Sign Up

I need connectivity

Clipper Controls Brand Icon

$40 Per Month/Site

+ $100 Setup Fee

Includes cellular data service for fully connected monitoring.

  • Cellular service provided
  • Initial hardware configuration
  • Custom templates and graphs
  • Unlimited users
  • Technical Support
Sign Up

Want to take control? 
Let's talk.

Call us
Send a Message
Clipper Controls Swallowtail Flag Logo

​Frequently Asked Questions

How do I access ClipperView?

ClipperView is accessed via your web browser (Chrome, Safari, Internet Explorer). You can use your desktop computer, or mobile device. All Apple and Android devices are supported - phone or tablet. Many of our users have a tablet on their desk to monitor site conditions.

What can I monitor with ClipperView?

Almost everything! Everything that the datalogger records is available in ClipperView for monitoring and trending.

A short list includes:

  • Flow
  • Humidity
  • Rainfall
  • pH

  • Velocity
  • Level
  • Temperature
  • Total Flow

  • Pressure
  • Wireless signal
  • Battery voltage

How do my sensors connect to ClipperView?

All sensors need to be connected to a data-logger that contains a cellular modem. Currently, supported data loggers are the Teledyne ISCO Duratracker, Signature, and the 2105 models. You will connect these devices using either the built-in connections or through the connections below.


Once your devices are connected to the datalogger, we configure the datalogger to push data regularly to ClipperView. We provide all configuration, or you may do so yourself.

Supported dataloggers and their supported sensors:

  • Teledyne ISCO Duratracker and Signature: MODBus, SDI-12, 4-20mA, and all TIE-NET devices (LaserFlow, bubbler, etc)
  • Teledyne ISCO BLIZZRD and Avalanche Sampler: MODBus, SDI-12, 4-20mA, and all 700 Series modules
  • Teledyne ISCO 6712 Sampler: MODBus, SDI-12, 4-20mA, and all 700 Series modules
  • Teledyne ISCO 2103/2105: MODBus, SDI-12, and all ISCO 2100 stack sensors

What sensors are supported?

ClipperView supports any Teledyne ISCO products, as well as any devices with MODBUS, SDI-12, or 4-20mA connections.

What applications can ClipperView monitor?

ClipperView's powerful trending and alarm monitoring is designed for any application with remote sensors in the field.

Specifically, ClipperView is suited for:

  • Stormwater and wastewater monitoring: Ensure compliance with local regulations and be alerted when abnormal conditions occur.
  • Remote sites with limited physical access: Since ClipperView is pushing data regularly, there is no need to visit remote sites, or sites that require confined space permits.
  • Infiltration and Inflow studies: ClipperView logs all critical data, and alarms if there is a surcharge or if batteries need to be replaced.

Is my data secure?

Yes. Your data is secured on AWS servers, and is backed up routinely. Our servers have built-in intrusion detection and are monitored by our security team.

I have devices in remote areas. How will this impact my battery?

For devices that are powered by batteries or solar, battery life can be a concern - particularly for time-critical I&I; studies. ClipperView has minimal impact on your battery as the cellular modem is not continously on. Every four hours, the modem connects to ClipperView and pushes the latest data. It then turns off to conserve battery.


See below about the difference between pushing and recording data.

How often is ClipperView updated with my data?

By default, your datalogger will contact ClipperView every four hours and "push" the data has recorded. This window is configurable, and can also push ad-hoc when certain conditions are met (surcharge, increased rainfall)


Note that the interval for pushing data is different from recording intervals. Your datalogger records all data internally in intervals as short as one minute. This data is then pushed to ClipperView at a different interval, every four hours. No data is lost.

How are alarm notifications sent?

You can receive alarms directly to your phone via text messages (SMS), or via email. Standard charges apply for receiving text messages.


As part of our service, we configure all alarms and destinations for you. If you would like to make any changes, please contact service@clippercontrols.com

How can I export my data? What formats are supported?

You can export your data to CSV, a common format that can be opened in Excel. Data can be exported as granular for a specific site, sensor and timerange.


To export your data:

  1. Inside ClipperView, select the Sites tab, then select the Export button at the top.
  2. Choose your Site NameTime Range, and select the Export Type.
  3. Select the Export Sites button at the lower right, and a "Job" will be created. Select the Jobs icon at the top, select Download Data and set the desired storage location.